Payment Velocity and Dashboard Charts
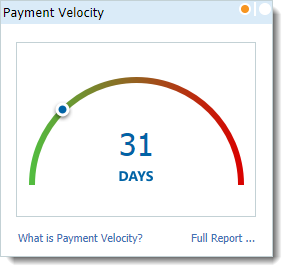
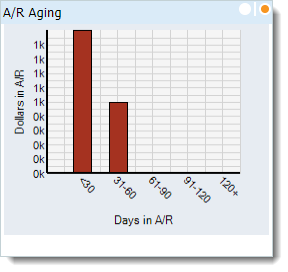
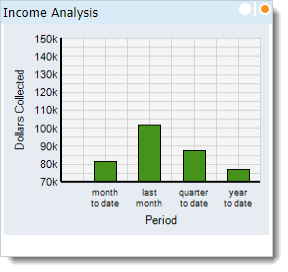
The Payment Velocity gauge is on the upper right of the Practice Home window. It displays a single number to help you measure and improve the health of your practice. Located in the same area, are two dashboard charts: A/R Aging and Income Analysis. These charts provide a visual snapshot of accounts receivable aging and income collected.
The Payment Velocity gauge and A/R Aging and Income Analysis charts are viewable for users such as System Administrators, Billing Managers, Providers or custom users with permissions to Key Indicators Reports (applicable for billing company accounts and accounts created prior to May 9, 2016).
Payment VelocityThe Payment Velocity gauge displays a single number that measures how quickly your practice is paid by insurance companies and patients; it is the average number of days from the date of service to the date payments are posted.
|
 |
A/R AgingThe A/R Aging chart is viewable for Business Offices Users (e.g., System Administrators, Billing Managers) and provides a visual snapshot of accounts receivable aging.
|
 |
Income AnalysisThe Income Analysis chart is viewable for Medical Offices Users (e.g., Providers) and provides a visual snapshot of the income collected for several key periods of accounting activity.
|
 |
