Billing Analytics provide you with an easy way to gauge your practice’s financial health. You can view insights on your patient visits, billing, collections, and accounts receivable. This section of the system is accessible to users with the role of System Administrator or Business Manager.
|
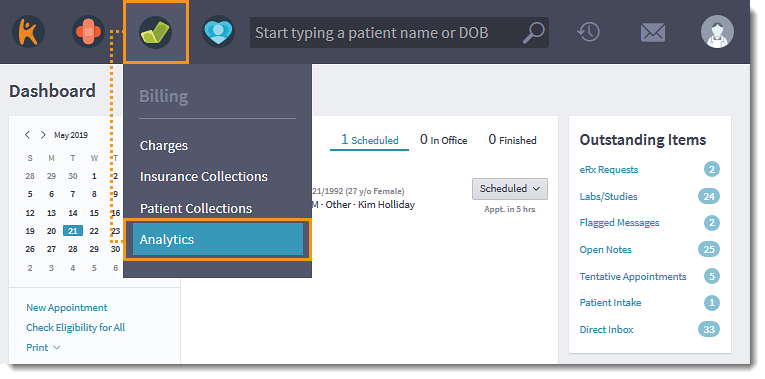
Access Billing Analytics
Hover over Billing icon on the top menu and select Analytics. The Billing Analytics window opens.
|
|
|
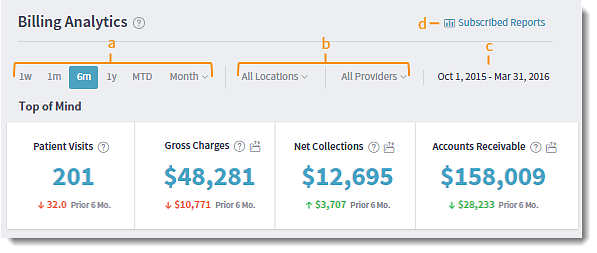
Filter Options
- Date: Use filters to view billing analytics for specific date range. Days for a selected date range display on the right. The 6m range is auto-selected by default.
- 1w - Last completed week (Monday through Saturday)
- 1m - Last completed month
- 6m - Last 6 completed months (default)
- 1y - Last 12 completed months
- MTD - Current calendar month to present date
- Month - Select a specific month in the past year
- Locations and Providers: Select to view billing analytics for a specific location or provider or all. All Locations and All Providers are auto-selected by default.
- The selected date range displays on the right of the filter options.
- Click Subscribed Reports to run, download, and view subscribed billing-related reports.
|
|
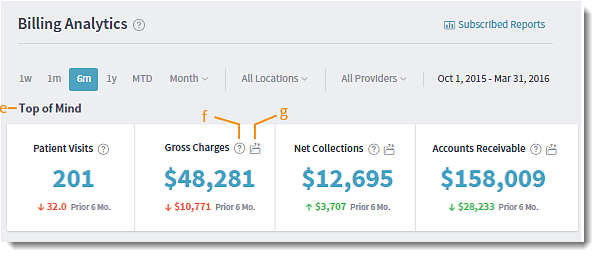
- Top of Mind
View high-level financial insights into how your practice is doing. A previous-period comparison displays at the bottom of each section to indicate whether current numbers are up, down, or in line with your average.
- Patient Visits: Displays the total number of patient visits for the selected date period.
- Gross Charges: Displays the total gross charge amount to show how much was billed for the selected date period.
- Net Collections: Displays the total collection amount for the selected date range.
- Accounts Receivable: Displays the total accounts receivable balance for the selected date period.
- Hover over the question mark icon to read a short description of the report.
- Click the folder icon to send an xml file of the report to your Kareo Messaging inbox.
Note: Reports are generated nightly and may take up to 48 hours for delivery.
|
 |
|
How Much Did I Bill
View insights into how much you are billing.
- Gross Charges: Displays the total gross charge amount for the selected date period. A comparison of the prior period and six-month average allows you to gauge whether you are billing more, less, or in line with your average.
- Average Gross Charges per Encounter: Displays a graph of your average gross charges per encounter for the selected date range.
- Top Procedures by Gross Charges: Lists your top five procedures and groups the remaining procedures into an Other category.
- Click Show Detail to view additional insights about your billing.
- Click on a category to view billing details within the selected date range and by date of service on the encounter:
- Encounters by date: A line graph showing a trend of your total number of encounters per month.
- Encounters by provider: A bar graph showing a breakdown of your total number of encounters per provider.
- Encounters by location: A bar graph showing a breakdown of your total number of encounters per location.
- Gross Charges by date: A line graph showing a trend of your total amount of charges being submitted per month.
- Gross Charges by provider: A bar graph showing a breakdown of your total amount of charges being submitted per provider.
- Gross Charges by location: A bar graph showing a breakdown of your total amount of charges being submitted per location.
- Click Export Data to send an xml file of the report to your Kareo Messaging inbox.
Note: Reports are generated nightly and may take up to 48 hours for delivery.
|

|
|
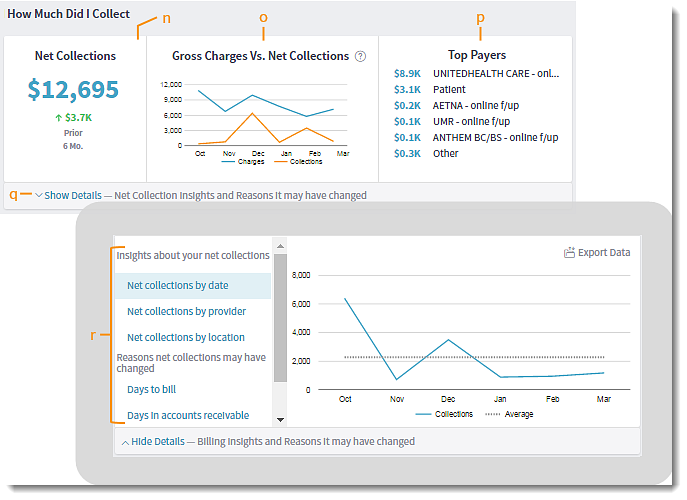
How Much Did I Collect
View your total collections, gross charges versus collections, and payers that you've collected from the most.
- Net Collections: View your total collection amount for the selected date period. A prior-period comparison indicates whether you are collecting more, less, or in line with your average.
- Gross Charges vs. Net Collections: View a trending graph of your gross charges compared to your collections. Hover over the graph points to see a detailed breakdown.
- Top Payers: Lists your top five payers and groups the remaining payers into an Other category.
- Click Show Detail to view additional insights about your collections.
- Click on a category to view collection details within the selected date range and by posting date:
Insights about your net collections
- Net Collections by date
- Net Collections by provider
- Net Collections by location
Reasons net collections may have changed
- Days to bill
- Days in accounts receivable
- Adjustments
- Refunds
|
|
|
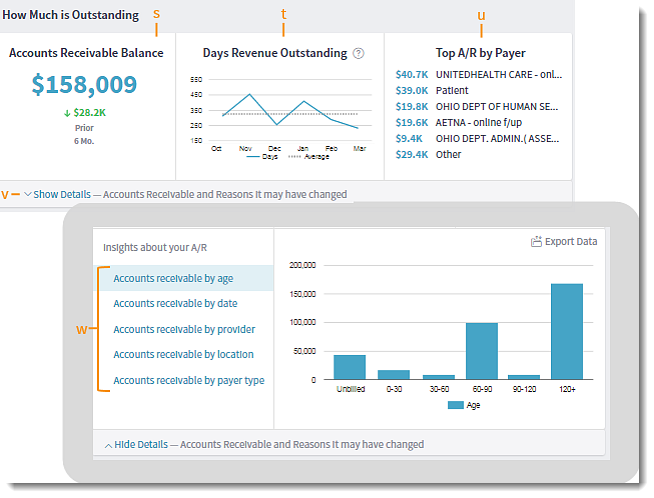
How Much is Outstanding
View your total Accounts Receivable balance, see how your Days Revenue Outstanding is trending, and check out your payers that have the highest A/R amount.
- Accounts Receivable Balance: Displays the total amount in Accounts Receivable. A prior period comparison indicates whether your A/R has gone up, down, or is consistent.
- Days Revenue Outstanding: Displays a graph that shows how your DRO is trending.
- Top A/R by Payer: Displays a list of your top five payers and groups the remaining payers into an Other category.
- Click Show Detail to view additional insights about your A/R.
- Click on a category to view A/R details by date of service:
- Accounts receivable by age: A vertical bar graph showing money owed to the practice, grouped by unbilled charges, 0-30, 30-60, 60-90, 90-120, and 120+ days buckets.
- Accounts receivable by date: A line graph showing a trend of the total money owed to the practice per month over the selected date period.
- Accounts receivable by provider: A bar graph showing a breakdown of money owed to the practice per provider as of the end date of the selected date period.
- Accounts receivable by location: A bar graph showing a breakdown of money owed to the practice per location as of the end date of the selected date period.
- Accounts receivable by payer type: A bar graph showing a breakdown of money owed to the practice per payer type as of the end date of the selected date period.
|
|